
Can Covered Call Rules Be Tested Before You Risk Real Money?
I’m Looking for 10 Founding Beta Testers for Covered Call Lab Pro

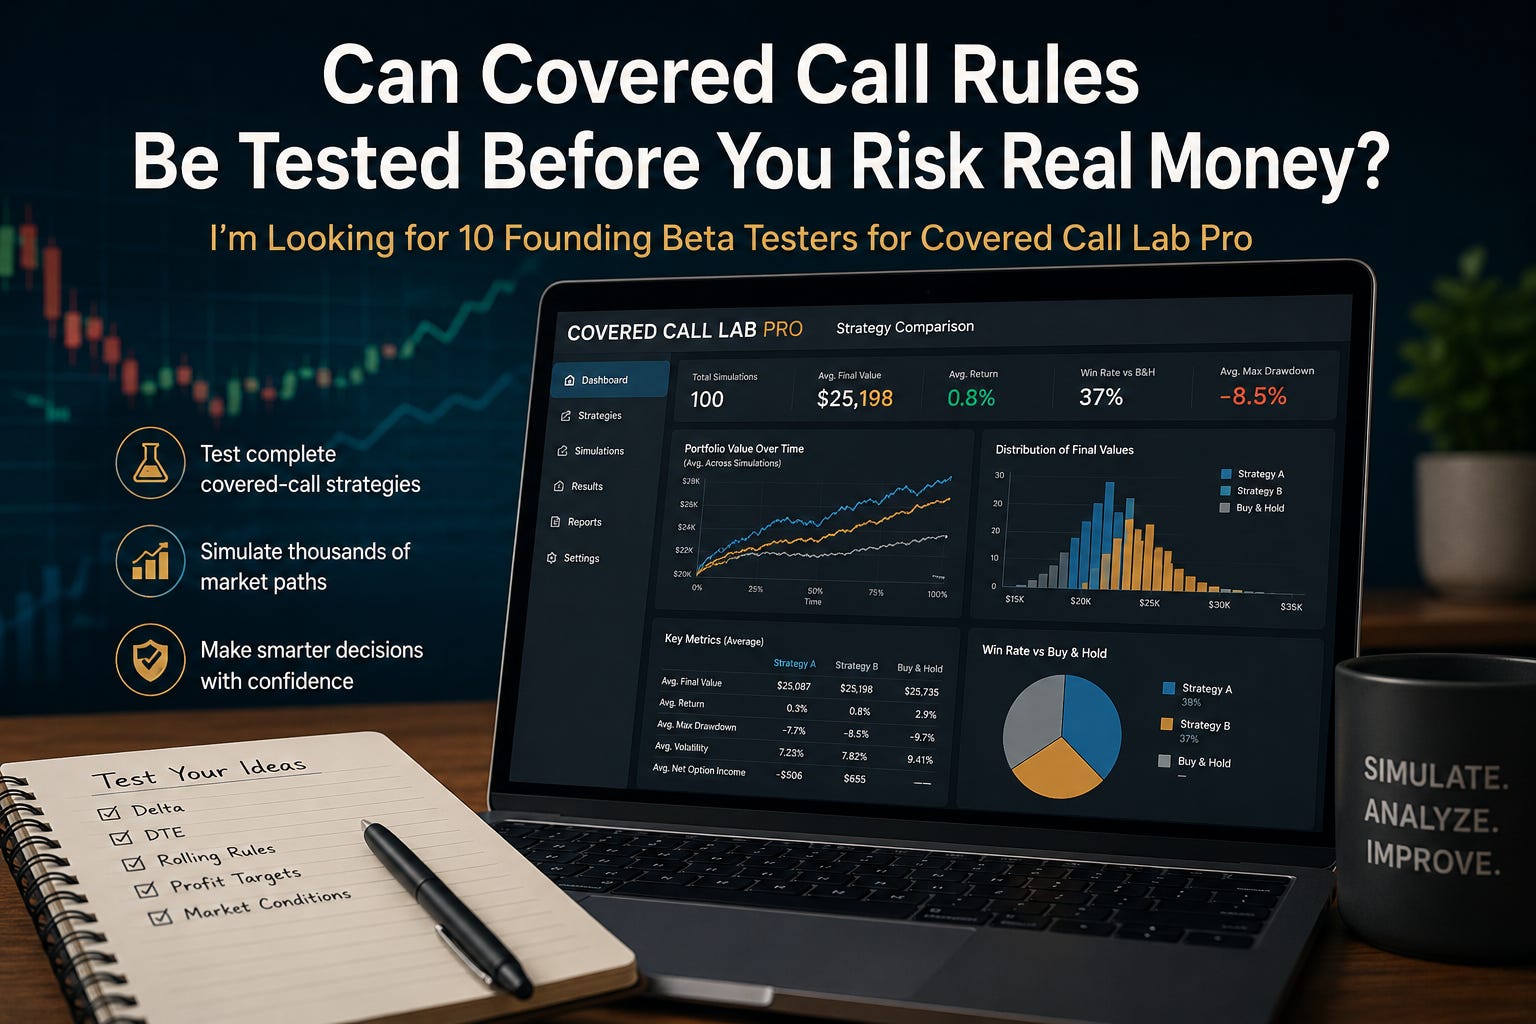
Covered-call investing is often presented as a straightforward income strategy:
Own 100 shares.
Sell a call option.
Collect the premium.
Repeat.
The mechanics are simple. Evaluating the strategy is not.
A covered call can outperform in a flat market, cushion part of a decline, or sharply underperform when the underlying stock rises quickly. Results also depend on delta, expiration length, rolling rules, profit targets, assignment handling, transaction costs, and the exact sequence of market returns.
That is why I developed Covered Call Lab Pro: a browser-based research simulator designed to test complete covered-call strategies rather than display only an expiration payoff diagram.
Unlike paper-trading platforms that depend on live markets, Covered Call Lab Pro uses simulated price paths. You can run controlled experiments during evenings, weekends, or whenever the market is closed.
You do not have to wait weeks or months to see how a strategy might behave. You can simulate a full trading year in minutes and repeat the experiment across many possible market paths.
Why a Covered-Call Simulator Is Useful
Many investors evaluate covered calls by looking at premium income alone.
That can be misleading.
A strategy may collect a large amount of gross premium while losing money through:
• buying calls back
• rolling at unfavorable prices
• repeated transaction costs
• slippage
• assignment
• surrendered stock appreciation
The relevant question is not simply:
How much premium did the strategy collect?
The more useful question is:
How did the complete portfolio perform after every option trade, stock-price change, assignment, repurchase, roll, fee, and opportunity cost was included?
Covered Call Lab Pro is intended to help answer that broader question.
What Covered Call Lab Pro Can Test
The simulator is designed to investigate questions such as:
• Is a 0.20-delta call preferable to a 0.30-delta call?
• Are 14-day calls more effective than 30-day calls?
• Does closing a call at 50% profit improve results?
• Do rolling rules preserve portfolio value or merely create additional buyback costs?
• How much upside is surrendered through assignment?
• Does a covered-call strategy reduce drawdowns?
• How often does the strategy beat buy-and-hold?
• Does collecting more premium actually produce more profit?
• How sensitive are the results to volatility and market direction?
• Does a rule that works on one price path continue to work across many different paths?
To illustrate why these questions matter, I ran several preliminary exercises using the current Pro simulator.
The examples below are not forecasts. They are demonstrations of the kinds of controlled experiments the simulator can perform.
Exercise 1: The Three Basic Covered-Call Outcomes
The first exercise examined three simple market environments.
Flat Market
The underlying investment began near $100 and remained close to that level through expiration.
The call expired worthless, the shares were retained, and the option premium became the covered-call strategy’s advantage over buy-and-hold.
This is the environment in which covered calls often work much as advertised: the investor collects income while continuing to own the shares.
Rising Market
The underlying investment rose sharply above the call strike.
The investor retained the premium, but the shares were assigned near the strike price. Most of the appreciation above that strike was surrendered.
In a strong rally, the premium received may be much smaller than the upside given away.
Falling Market
The underlying investment declined substantially.
The call expired worthless, and the premium reduced the loss. However, the investor still experienced most of the decline in the underlying shares.
The premium provided a cushion. It did not provide complete downside protection.
These three cases summarize the central covered-call tradeoff:
Premium income helps most in flat or moderately declining markets, but the short call can materially limit gains during a strong advance.
Exercise 2: Strategy A Versus Strategy B
The second exercise compared two covered-call strategies over the same one-year simulated price path.
Both strategies began with:
$25,000 of equity
An underlying price of $100
252 trading days
The same simulated market path
A 4% risk-free rate
Reinvestment after assignment
Fees and slippage enabled
The underlying investment ended the simulated year at $117.38.
Strategy A
0.30 delta
14 days to expiration
Close at 50% profit
Roll in-the-money calls with three days remaining
Strategy B
0.20 delta
30 days to expiration
Close at 50% profit
No rolling
Preliminary Results
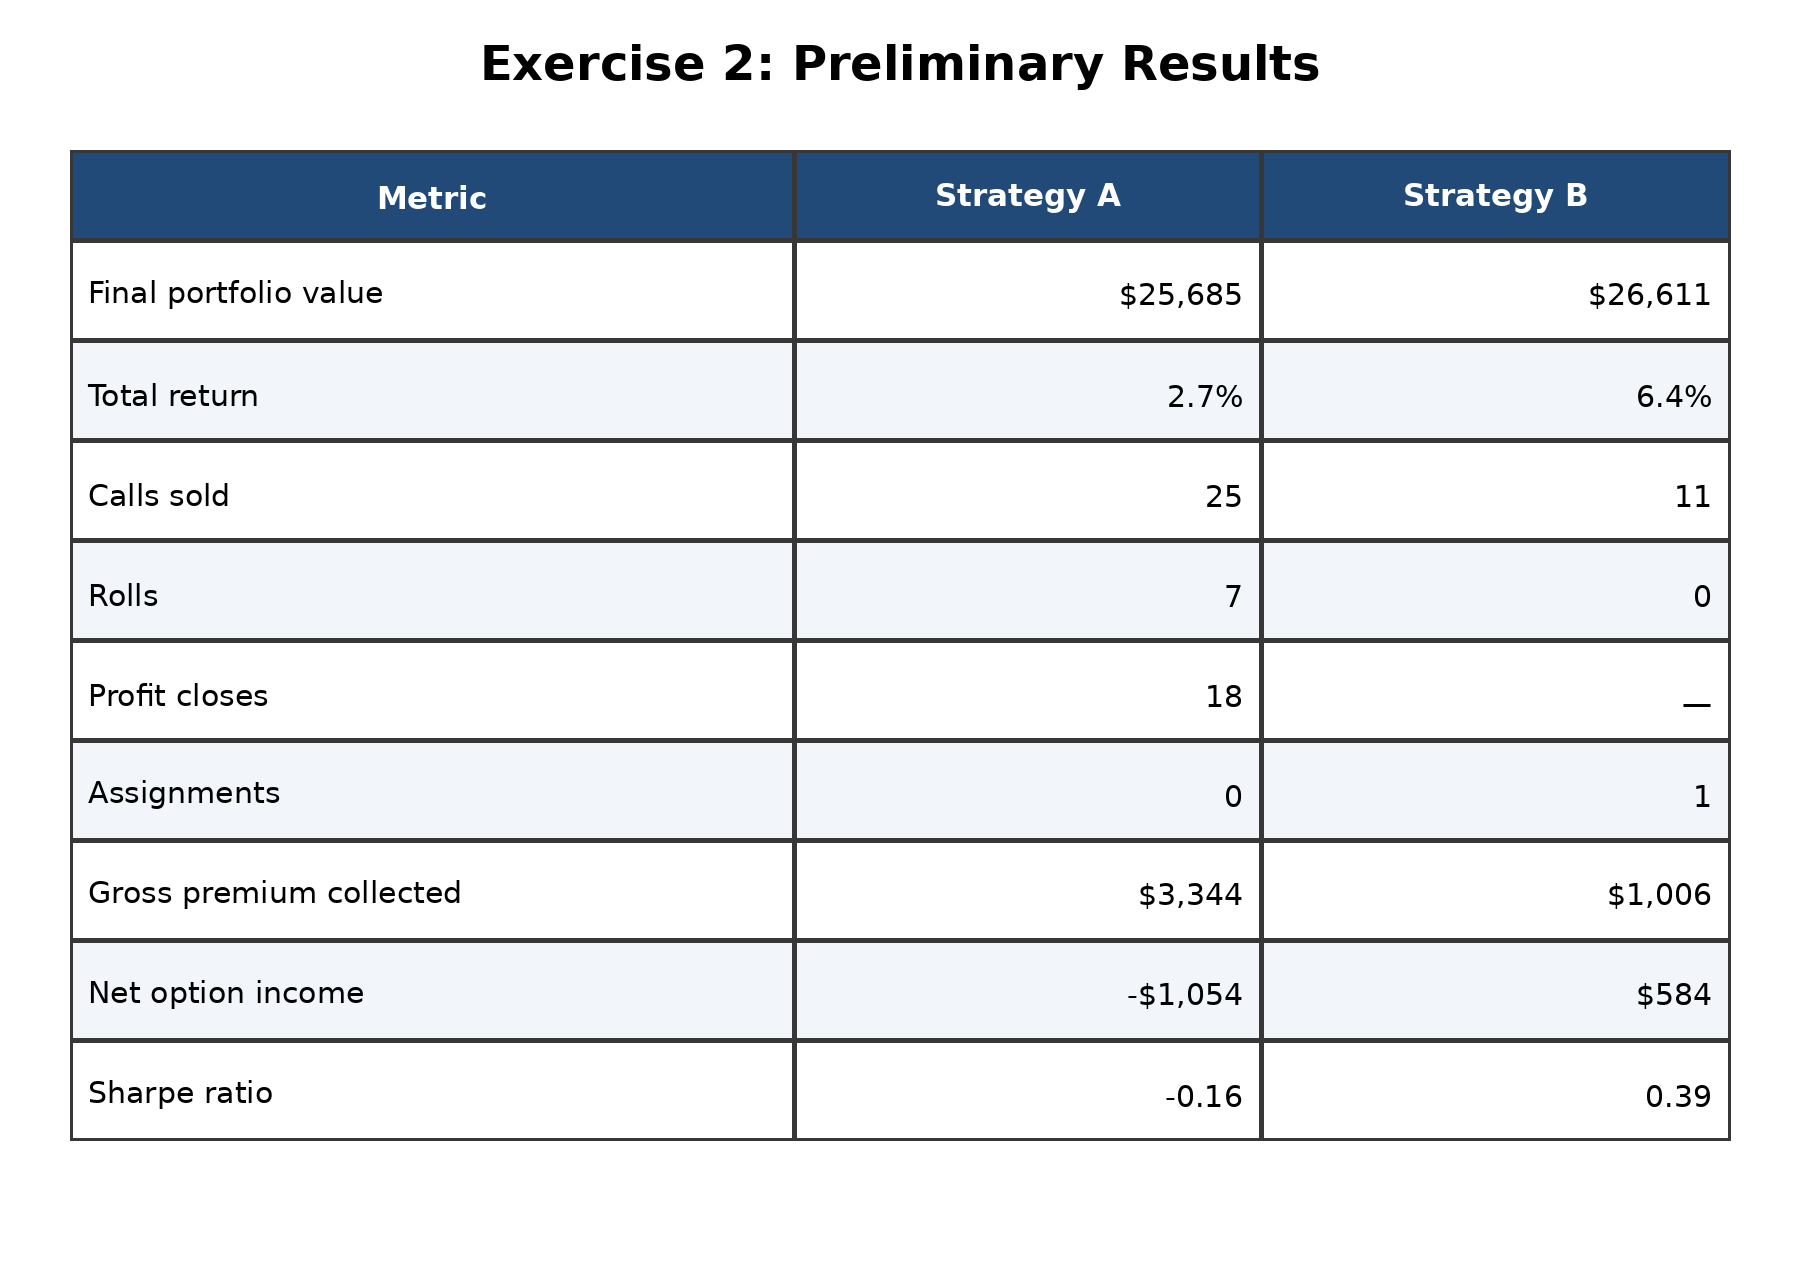
Strategy B finished $926 ahead of Strategy A.
At first glance, this result may seem surprising because Strategy A collected substantially more gross option premium.
Strategy A sold more calls, traded more frequently, and collected $3,344 in gross premium compared with only $1,006 for Strategy B. However, once call repurchases, rolling costs, transaction fees, and the effects of frequent trading were included, Strategy A actually produced negative net option income.
Strategy B, despite collecting far less premium, finished the year with positive net option income and the higher overall portfolio value.
This illustrates one of the most important lessons from the simulator:
Gross premium collected is not the same as investment profit.
A strategy can appear successful because it repeatedly collects option premium while quietly giving back even more through buybacks, rolling costs, commissions, slippage, and missed stock appreciation.
Looking only at premium income can therefore lead investors to conclusions that are exactly opposite to what actually happened to the portfolio.
These results represent a single simulated market path. To determine whether one strategy consistently outperforms another, we need to repeat the comparison over many different possible market paths.
That is where Monte Carlo simulation becomes valuable.
Exercise 3: Monte Carlo Comparison
A single simulated year can be informative, but no single market path can establish whether a strategy is consistently superior.
The next experiment repeated the comparison between Strategy A and Strategy B over 100 independently simulated market paths.
Within each trial, Strategy A, Strategy B, and a buy-and-hold portfolio all experienced the same simulated price path. This matched-path approach isolates the effects of the strategy rules themselves rather than differences in market conditions.
The table below summarizes the average results across all 100 simulations.
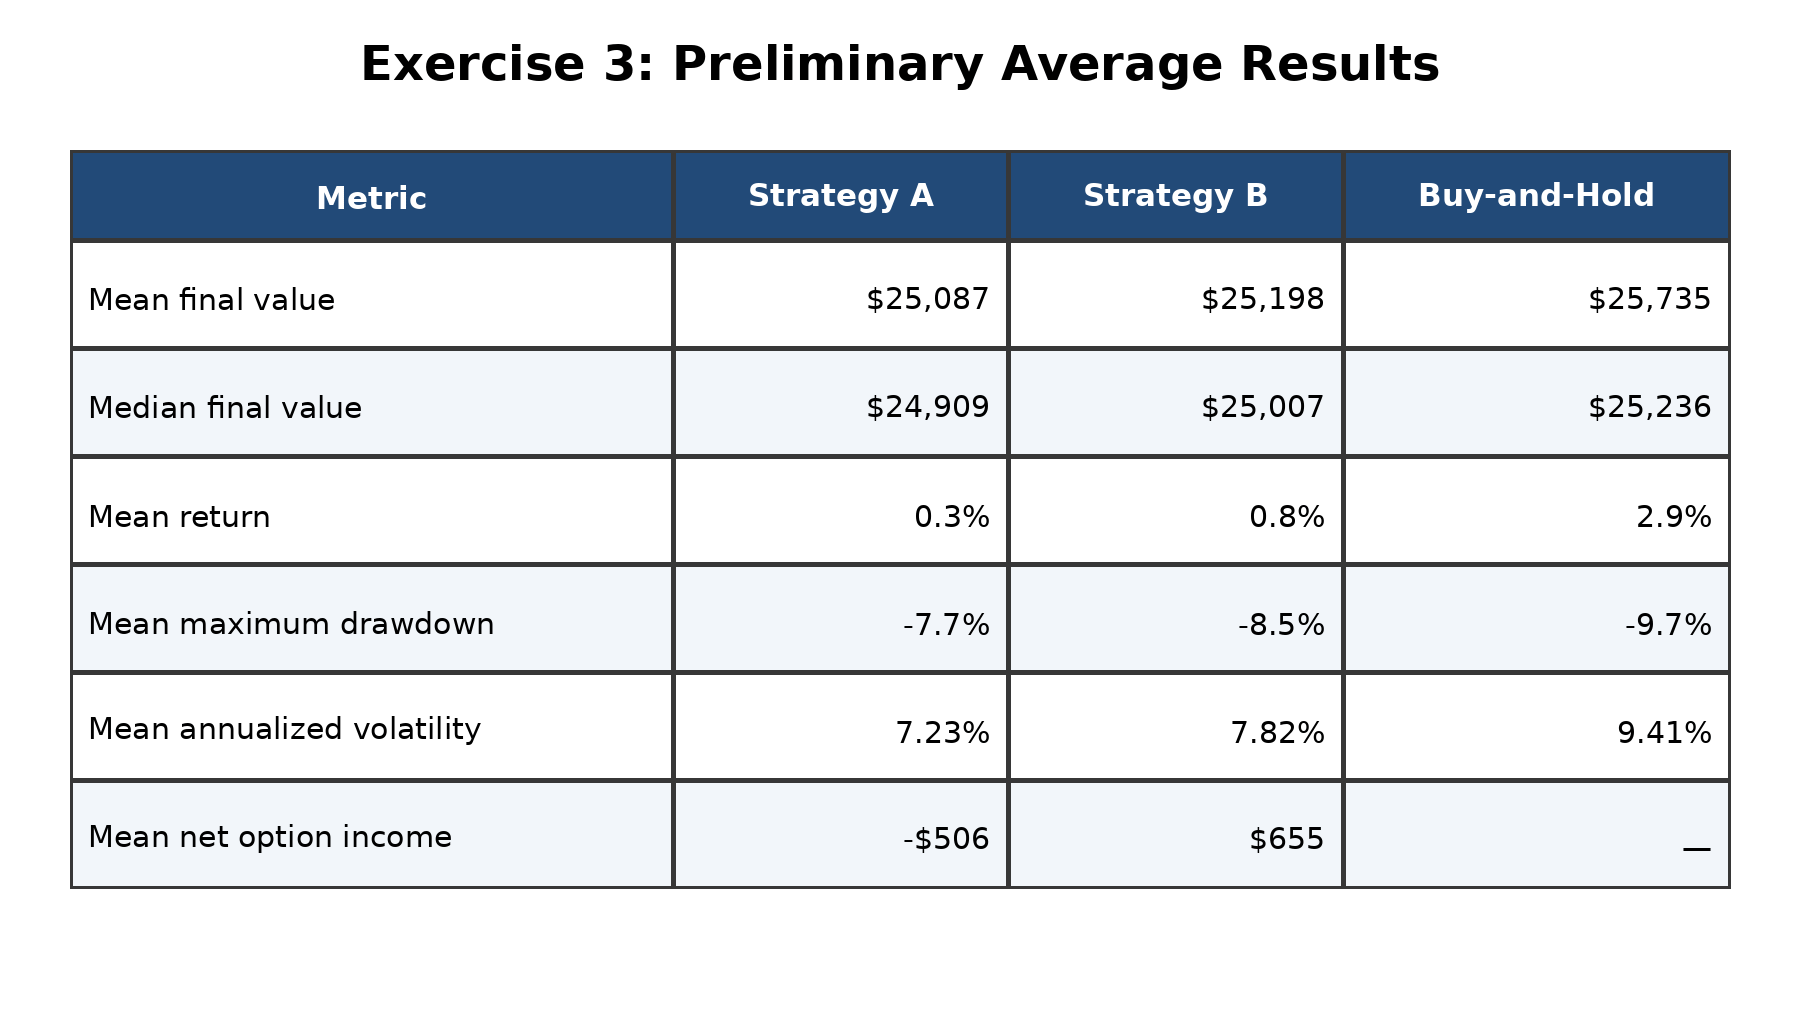
Several observations emerge from these averages.
First, neither covered-call strategy matched the average final portfolio value of the buy-and-hold portfolio over this particular set of simulations. This is not unexpected. Covered calls exchange some upside potential for immediate option premium, so they often trail buy-and-hold during sustained rising markets.
Second, the difference between the two covered-call approaches was relatively modest. Strategy B produced a slightly higher average final portfolio value and a higher average return than Strategy A, suggesting that the simpler rule set performed at least as well under these simulated conditions.
Third, both covered-call strategies exhibited lower average annualized volatility than buy-and-hold. Although the reduction was not dramatic, it illustrates one of the principal reasons investors employ covered calls: they are often willing to sacrifice some upside in exchange for a smoother investment experience.
One result deserves special attention. Strategy A generated substantially more trading activity yet produced negative average net option income, whereas Strategy B generated positive average net option income. This reinforces the earlier conclusion that maximizing premium collection alone does not necessarily maximize total portfolio performance.
Average results, however, tell only part of the story.
Investors also want to know how often one strategy actually outperformed another. That question is answered by examining the percentage of simulations in which each strategy finished ahead of its competitor.
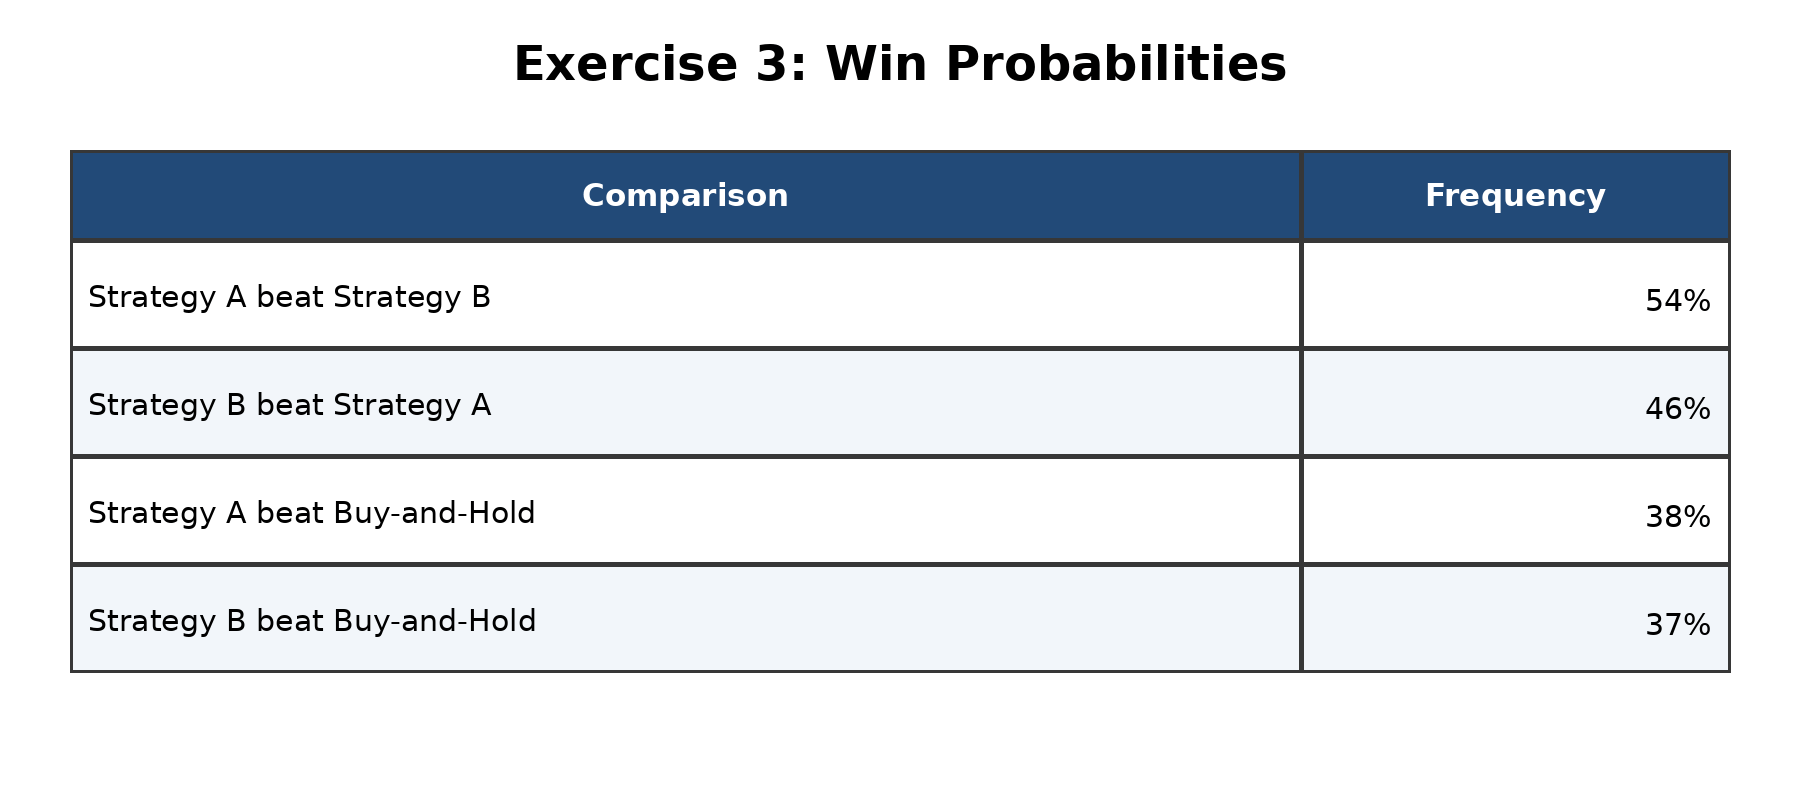
The win frequencies reinforce an important point.
Neither covered-call strategy consistently dominated the other. Instead, the outcome depended on the particular market path. Strategy A finished ahead of Strategy B in 54% of the simulations, while Strategy B finished ahead in 46%. In other words, the two approaches were competitive over this set of preliminary tests.
More revealing is the comparison with buy-and-hold. Both covered-call strategies outperformed buy-and-hold in fewer than half of the simulations. This reflects one of the fundamental trade-offs of covered-call investing. Selling calls generates immediate option income, but it also limits participation in strong upward price movements. During extended bull markets, that trade-off often favors simply holding the underlying shares.
On the other hand, many investors do not use covered calls solely to maximize returns. They may value the additional cash flow, the discipline of a rule-based strategy, or the possibility of reducing portfolio volatility. Which strategy is “best” therefore depends on an investor’s objectives, risk tolerance, and market expectations.
The simulator allows users to investigate these trade-offs by changing assumptions such as option delta, days to expiration, rolling rules, volatility, commissions, and market conditions. Rather than relying on general advice, users can test how different choices affect outcomes across many simulated market environments.
Why I’m Looking for Beta Testers
Covered Call Lab Pro has reached the stage where it needs evaluation by active investors.
I’m looking for approximately 10 founding beta testers who regularly trade covered calls—or who are interested in learning—to explore the simulator and provide constructive feedback.
Beta testers will be asked to:
Explore the interface and features.
Complete several guided simulation exercises.
Try one or more strategies of their own choosing.
Report bugs, confusing behavior, and suggestions for improvement.
In return, everyone who completes the beta program will receive one year of complimentary access to the Pro version when it is officially released.
The planned subscription price is expected to be approximately:
$9.99 per month, or
$79 per year
Beta participants who complete the evaluation will receive that first year at no cost.
Interested?
If you’d like to participate, simply complete the short registration form below.
Beta Registration Form
I’ll review the applications and contact selected participants with access instructions.
I look forward to hearing your ideas and using your feedback to make Covered Call Lab Pro a better research and learning tool for everyone.
Disclaimer: The results shown above are preliminary examples generated with the current development version of the simulator. They are intended to illustrate how the software can be used, not to recommend any investment strategy or predict future performance. Actual investment results will vary depending on market conditions, transaction costs, taxes, and investor decisions.