
Do Covered Calls Really Reduce Risk?
Five Monte Carlo Experiments Using a Free Covered Call Simulator

Abstract
Mark L. Morrissey, July 2026
Pilot Research Article - Version 1.0
Experiments reviewed: CC-RISK-001 Baseline through CC-RISK-005 Market Regimes
Publication status: Pilot research conducted with the free public Covered Call Simulator. Educational research; not investment advice.
Research instrument: Covered Call Simulator - Public Pilot Version
Covered calls are often described as a conservative income strategy, but the phrase “reduce risk” can refer to several different outcomes. This pilot study uses the free public Covered Call Simulator to compare buy-and-hold with a single covered call across five controlled Monte Carlo experiments: baseline conditions, volatility, simulator delta label, holding period matched to expiration, and expected-return regime. Across the experiments, the covered call consistently reduced the probability of a modest short-term loss and lowered ending-value dispersion. The lower tail improved by the premium received, but the underlying stock downside remained largely intact beyond that cushion. The strategy also created asymmetric opportunity cost: its maximum ordinary advantage was limited to the premium, while underperformance during strong rallies could be much larger. The central finding is therefore not that covered calls are universally safer or superior, but that they reshape the distribution of outcomes—reducing some common short-horizon risks while sacrificing part of the right tail.
What you’ll learn
Which conventional risk measures improved in the simulator.
Why a covered call can win on most paths yet still have a lower mean outcome.
How volatility, strike-selection setting, holding period, and market regime changed the tradeoff.
Why premium income is a limited cushion rather than comprehensive downside protection.
Findings after five experiments
Across the baseline, volatility, delta, expiration, and market-regime tests, the covered call consistently reduced short-horizon loss probability and ending-value dispersion. The benefit was largest in bearish settings and with larger premiums. The cost remained asymmetric: protection was limited to the premium, while strong upside paths could create much larger underperformance. Mean return was therefore not uniformly improved.
The claim sounds simple. The tradeoff is not.
Covered calls are commonly described as a conservative income strategy. An investor owns shares and sells a call option against them, collecting an upfront premium in exchange for limiting some of the stock’s upside. Because the premium provides a small cushion, the position is often said to “reduce risk.”
That statement can be true, but it is incomplete. Risk can mean the probability of any loss, the chance of a large loss, variability of outcomes, downside-tail severity, or the possibility of underperforming during a strong rally. A covered call can improve some of these measures while making another form of risk—opportunity-cost risk—more pronounced.
This pilot study uses the free public Covered Call Simulator to examine buy-and-hold and a single covered call across five controlled Monte Carlo experiments. The objective is not to prove that covered calls are universally safer. It is to identify exactly which risks changed under the tested assumptions and what the investor gave up in return.
The Free Public Covered Call Simulator
The experiments in this article were performed with the Covered Call Simulator, a free public educational web application developed as a pilot platform for exploring the statistical behavior of covered-call positions under controlled assumptions. It is designed to support transparent, repeatable experiments rather than to predict market prices or reproduce every feature of a live options market.
The simulator generates Monte Carlo stock-price paths from user-selected assumptions, including starting price, expected return, volatility, account size, strike-selection setting, and time horizon. For each simulated ending stock price, it calculates the ending value of both buy-and-hold and a comparable single covered-call position. The two strategies are evaluated on the same simulated paths, so their paired differences arise from the option payoff rather than from different market scenarios.
The public pilot uses simplified strike and premium heuristics. It does not use a live option chain, and its delta labels should be interpreted as simulator controls rather than independently verified market Greeks. The tool is therefore most useful for controlled sensitivity testing and for illustrating payoff tradeoffs, not for producing trade recommendations.
Free public simulator:
Why This Is a Pilot Study
This article reports the first systematic five-experiment investigation conducted with the public pilot simulator. Its purpose is narrow: to determine which measures of short-horizon risk change when one covered call is added to an otherwise identical buy-and-hold position.
The five experiments examine a baseline case and controlled changes in volatility, simulator delta label, holding period matched to option expiration, and expected-return regime. Many real-world complexities were intentionally excluded so that the basic payoff structure could be isolated before more elaborate research designs are attempted.
How the baseline experiment was constructed
The experiment generated 100,000 paired Monte Carlo stock paths. “Paired” means that both strategies faced the identical simulated ending stock price on every trial. This removes path-selection noise from the strategy comparison: any difference between the two outcomes comes from the call option, not from different stock scenarios. All experiments were performed with the free public simulator at https://covered-call-lab.netlify.app using the settings documented in this article and the associated experiment outputs.
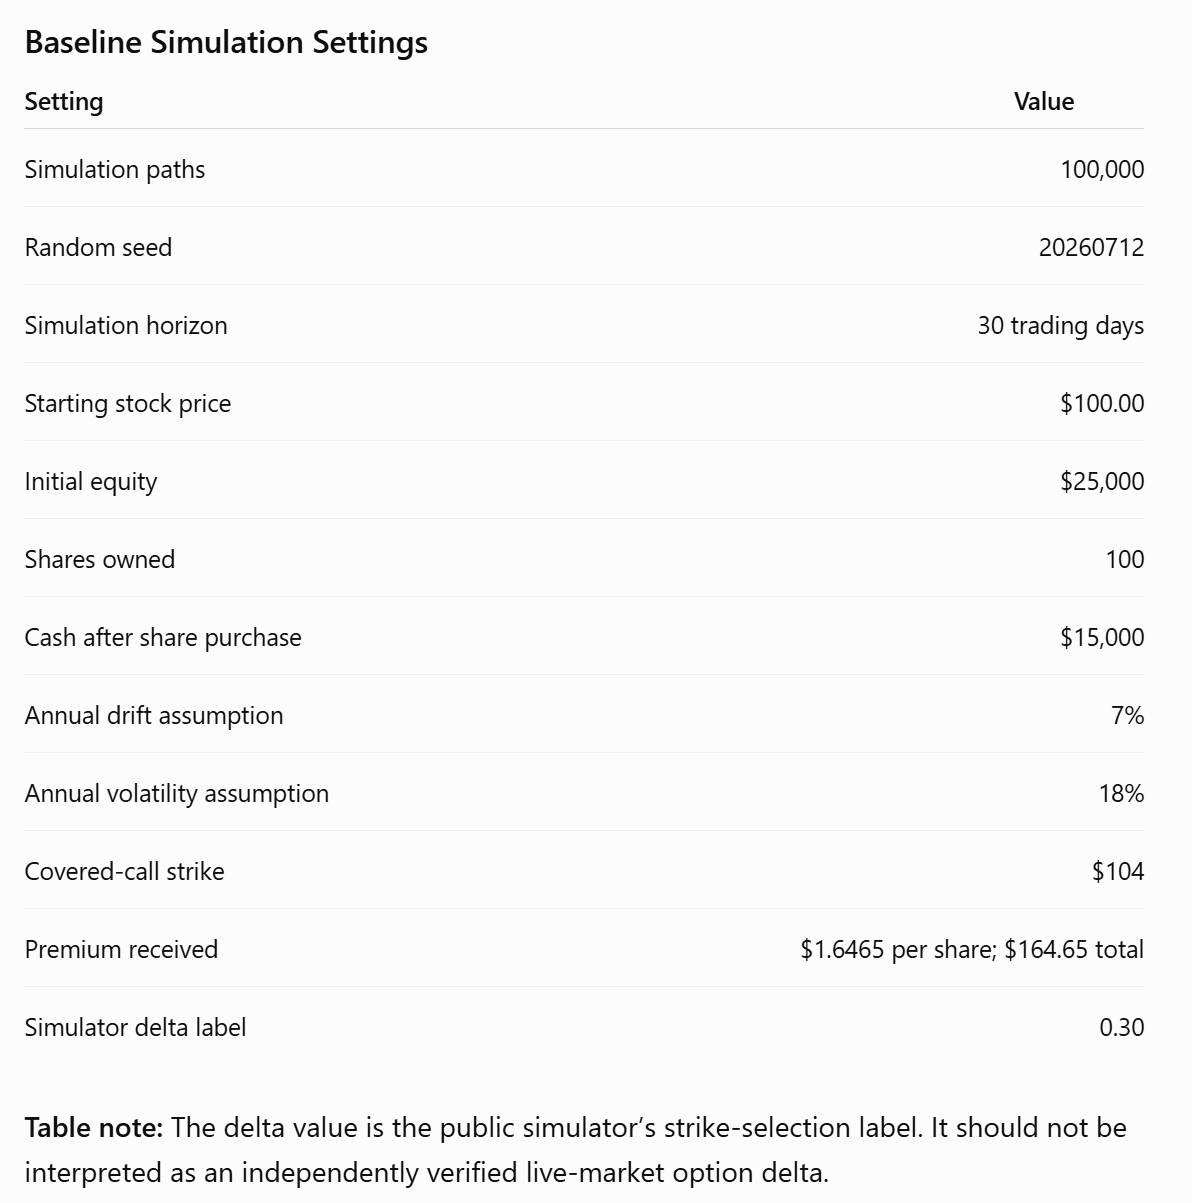
Important methodological note: the “0.30 delta” value is the public simulator’s strike-selection label. It should not be interpreted as an independently verified market-option delta.
Baseline results
The covered call produced a lower mean ending value but a higher median ending value, lower dispersion, and better downside-frequency statistics. The distinction between the mean and the median is central to understanding the strategy.
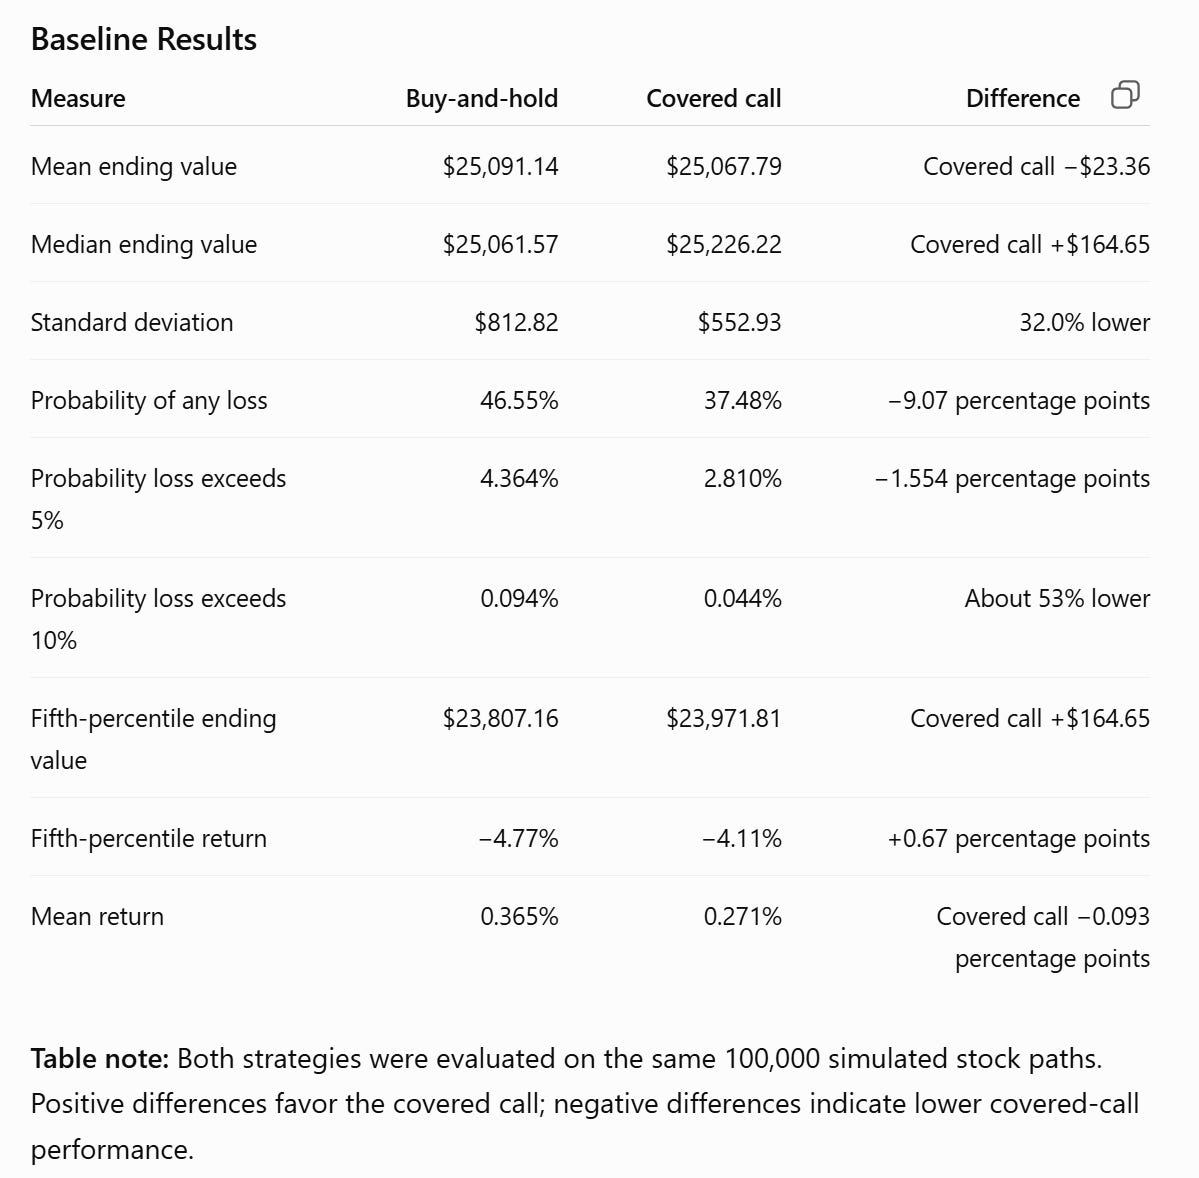
The covered call won more often—but earned less on average
The covered call finished ahead of buy-and-hold on 74.899% of paths. Buy-and-hold finished ahead on 25.101%, with a negligible 0.024% tie rate. At first glance, it may seem contradictory that the covered call won almost three-quarters of the time while still producing a slightly lower average ending value.
The explanation is asymmetry. When the call did not create an upside cost, the strategy’s maximum advantage was the premium: $164.65. But when the stock rose far above the $104 strike, buy-and-hold retained the full increase while the covered-call payoff was capped. In the simulated sample:
Maximum covered-call outperformance: $164.65—the total option premium.
Average upside sacrificed across all paths: $188.01.
Average upside sacrificed when assigned: $584.88.
Largest covered-call underperformance observed: $6,053.40.
Assignment frequency: 32.145%.
Why the median and mean moved in opposite directions
The median path gained the full $164.65 premium relative to buy-and-hold. A smaller group of strong stock rallies generated losses relative to buy-and-hold that were much larger than $164.65. Those right-tail outcomes pulled down the covered call’s mean even though it won on most individual paths.
Volatility sensitivity: the cushion persists, but its relative value shrinks
CC-RISK-002 repeated the 30-trading-day comparison at six fixed annual-volatility assumptions: 10%, 15%, 18%, 25%, 35%, and 50%. Each scenario used 100,000 paths, the same 7% annual drift, the same $25,000 starting account, and common random numbers across scenarios. The public simulator’s strike and premium heuristics were recalculated at each volatility level.
Methodology differs from the baseline
CC-RISK-002 holds volatility constant within each path so that volatility can be isolated as the experimental variable. CC-RISK-001 used the deployed simulator’s full stock-path behavior. The 18% rows in the two experiments therefore should not be expected to match exactly.
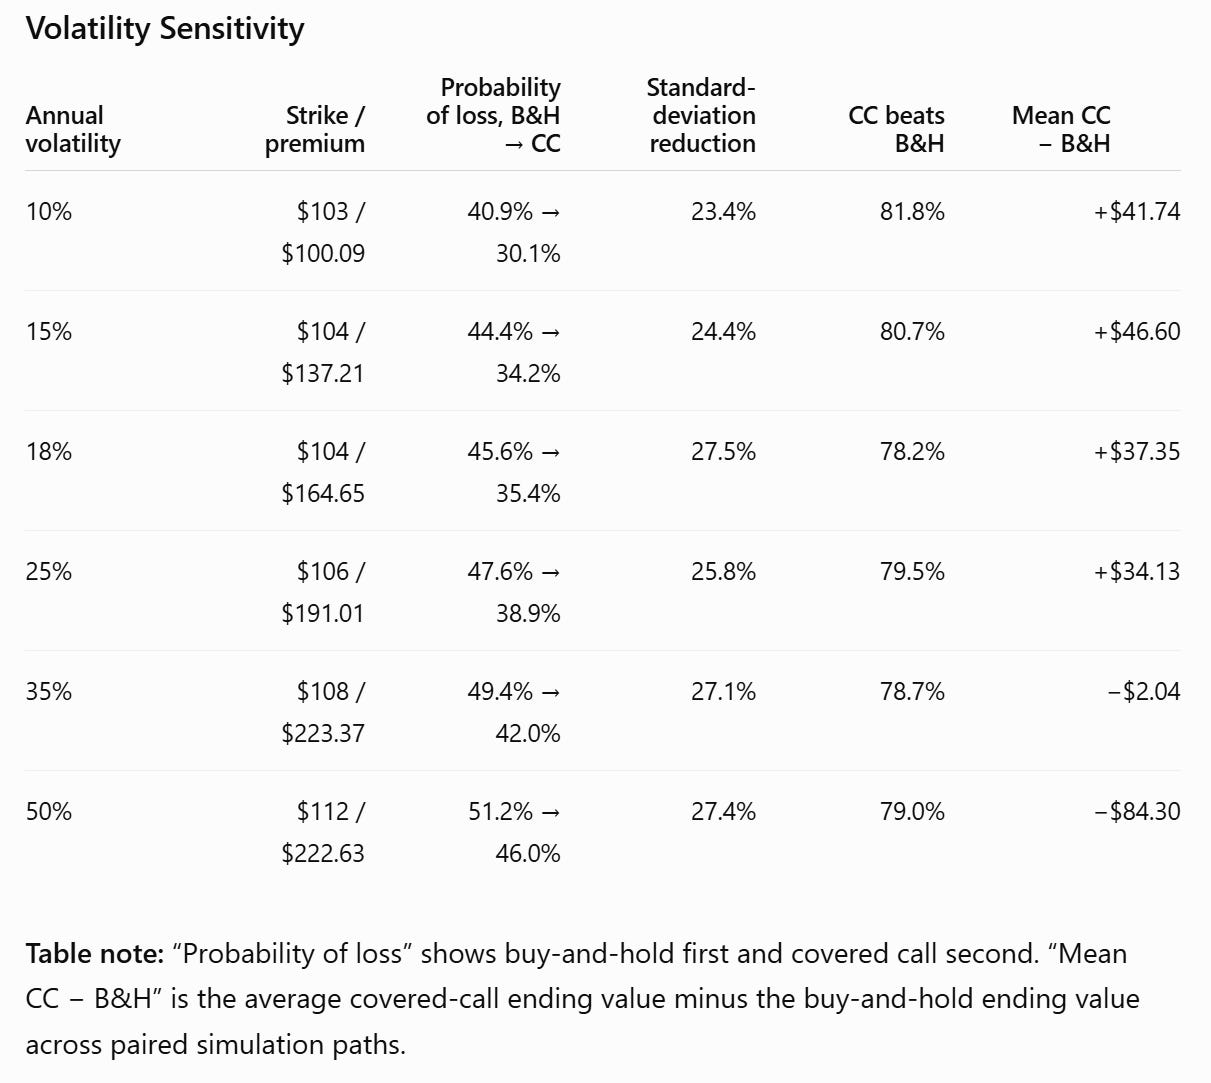
Table 2. Fixed-volatility sensitivity results. “Mean CC − B&H” is the average ending-value difference across paired paths.
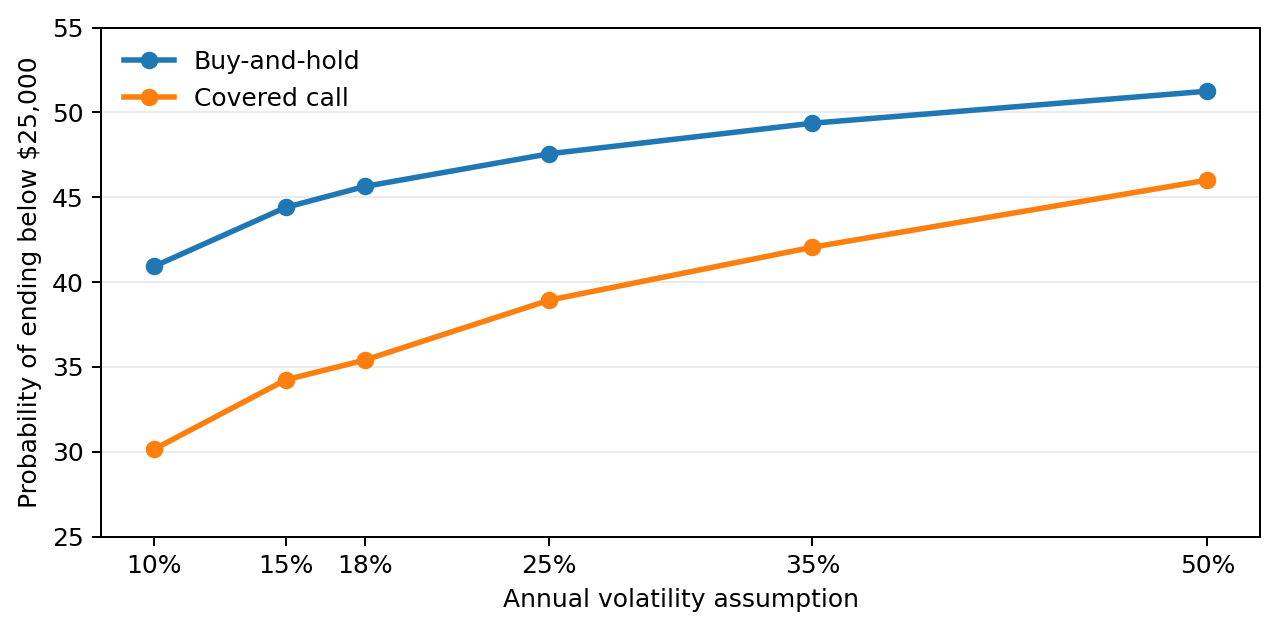
Figure 1. Probability of any loss across fixed-volatility scenarios.
The same basic risk effect appeared at every volatility level
The covered call lowered the probability of any loss in all six scenarios. The reduction was about 10 percentage points at 10%–18% volatility, 8.6 points at 25%, 7.3 points at 35%, and 5.2 points at 50%. Ending-value standard deviation was also lower in every case, by approximately 23%–27%.
The fifth-percentile improvement equaled the premium in each scenario—from $100.09 at 10% volatility to roughly $223 at 35%–50% volatility. This is exactly what the payoff structure predicts when the lower-tail stock price remains below the strike: the call premium shifts the covered-call outcome upward by a fixed amount, but does not change the underlying slope of the stock loss.
Higher volatility made the upside tradeoff more expensive
The covered call still beat buy-and-hold on approximately 78%–82% of individual paths across the entire volatility range. Yet the mean advantage weakened as volatility rose. It was positive from 10% through 25% volatility, approximately flat at 35%, and negative by $84.30 at 50% volatility.
Average upside sacrificed when assigned rose from $219.87 at 10% volatility to $1,253.53 at 50% volatility.
Average upside sacrificed across all paths rose from $58.35 to $306.93.
The premium increased from $100.09 to about $223, but the public simulator’s heuristic did not continue increasing the premium at 50% volatility because the selected strike also moved farther out of the money.
Volatility result
Higher volatility did not remove the covered call’s short-horizon risk-reduction effect. It made the premium cushion larger in dollars, but the stock’s possible moves expanded even faster. The strategy therefore continued to win on most paths while becoming less competitive on an average-value basis.
Delta sensitivity: more premium buys more short-term protection—and sells more upside
CC-RISK-003 held the stock-path assumptions constant—100,000 paths, 7% annual drift, 18% annual volatility, and a 30-trading-day horizon—while varying the public simulator’s delta label from 0.15 to 0.40. Common random numbers were used, so every delta scenario faced the same simulated ending stock prices. As the delta label increased, the selected strike moved closer to the starting stock price and the premium rose.
Delta labels are simulator controls, not verified market Greeks
The 0.15, 0.25, 0.30, and 0.40 values invoke the public simulator’s strike-and-premium heuristics. They describe relative strike choices within this experiment and should not be read as independently calculated option deltas from a live options chain.
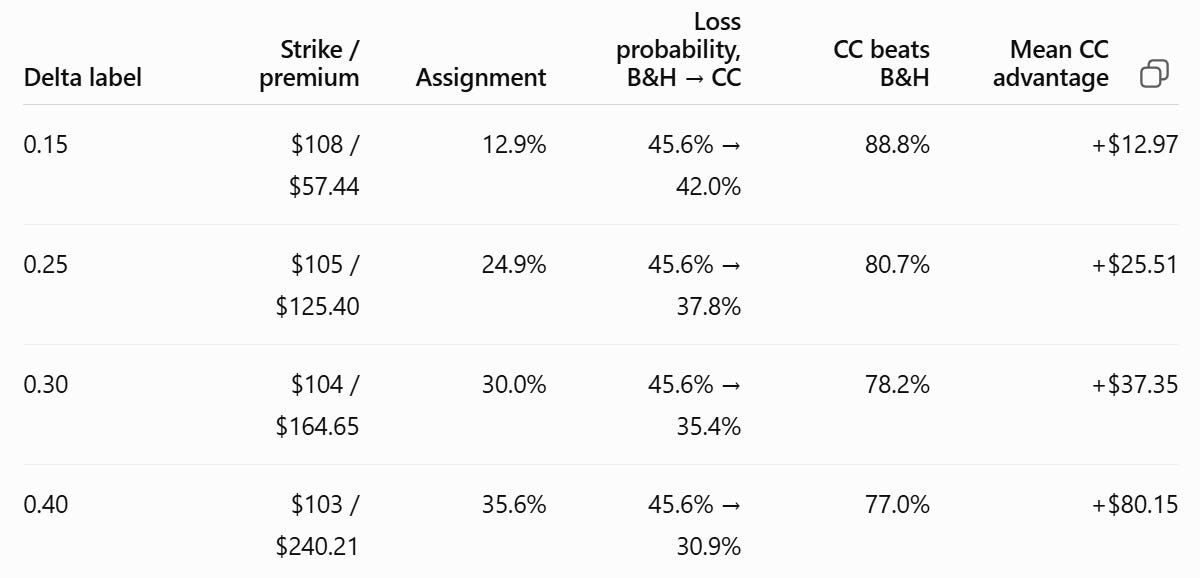
Table 3. Delta sensitivity results. Loss probability is shown as buy-and-hold → covered call; “CC beats B&H / mean difference” combines the paired-path win rate and average ending-value difference.
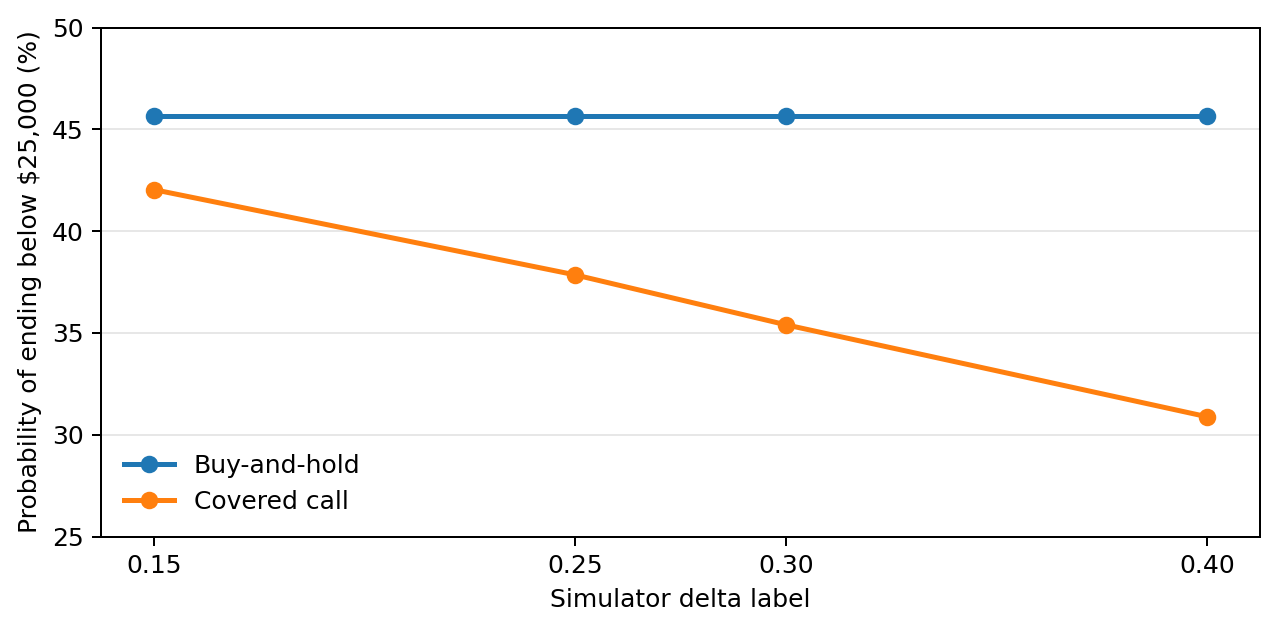
Figure 2. Probability of any loss across the four simulator delta labels.
A closer strike reduced conventional risk measures more strongly
Moving from the 0.15 label to the 0.40 label increased the total premium from $57.44 to $240.21. The probability of finishing below the initial $25,000 fell from 42.0% at the 0.15 setting to 30.9% at the 0.40 setting, compared with 45.6% for buy-and-hold on the same paths. Ending-value dispersion also fell more sharply: the standard-deviation reduction increased from 12.5% to 32.4%.
The fifth-percentile ending value improved by exactly the premium in every scenario. That is the direct lower-tail effect of the option credit in this one-period design: when the stock finishes well below the strike, the call expires worthless and the premium shifts the covered-call outcome upward dollar for dollar.
The price of the larger cushion was more frequent assignment
Assignment frequency rose from 12.9% at the 0.15 setting to 35.6% at the 0.40 setting. At the same time, the probability that the covered call beat buy-and-hold declined from 88.8% to 77.0%. The lower-delta call won on more paths because its distant strike preserved more stock upside, even though it supplied less premium protection.
Median covered-call outperformance equaled the premium in every scenario: $57.44, $125.40, $164.65, and $240.21.
Average upside sacrificed across all paths increased from $44.46 at the 0.15 setting to $160.07 at the 0.40 setting.
Average upside sacrificed when assigned increased from $343.78 to $449.84.
In this particular 30-day, 7%-drift experiment, the larger premium more than offset the average sacrificed upside at every delta setting, so mean covered-call outperformance rose from $12.97 at 0.15 to $80.15 at 0.40. That is a scenario-specific result, not a general ranking of delta choices. A stronger upward market regime can make the closer strike substantially less attractive because more of the stock’s right tail is capped.
Delta result
Within this simulator, moving the strike closer to the stock price increased the premium and improved conventional short-horizon risk measures, but it also increased assignment and reduced the percentage of paths on which the covered call beat buy-and-hold. Delta choice therefore determines how much upside is exchanged for how much immediate protection.
Holding-period (expiration) sensitivity: longer commitments increased the upside cost faster than the cushion
CC-RISK-004 compared buy-and-hold with a single covered call over four investment horizons: 14, 30, 45, and 60 trading days. In each scenario, the covered call was held until its expiration, which matched the investment horizon. Both strategies were therefore evaluated over the same holding period, while only the covered-call strategy included an option. Each scenario used 100,000 paths, a 7% annual drift, 18% annual volatility, a $25,000 starting account, and the public simulator’s 0.30 delta label. Common daily shocks were used across scenarios, with longer holding periods extending the same path prefixes.
One call per horizon—not an annualized overwrite program
These results compare terminal outcomes for a single call held to each expiration. They do not assume that a 14-day call is repeatedly sold four times while a 60-day call is held once. The findings therefore describe expiration sensitivity for one trade, not the annual profitability of repeated short-dated selling.
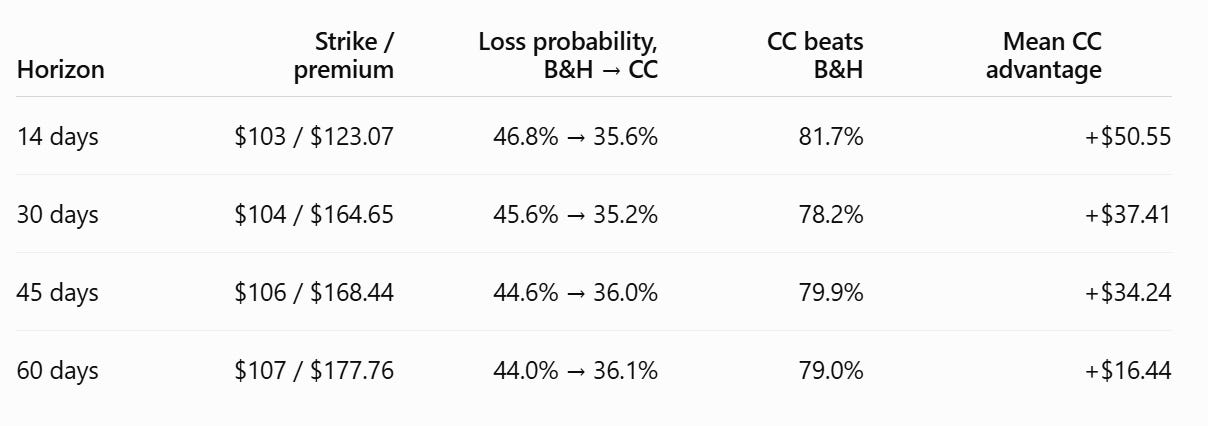
Table 4. Holding-period sensitivity for one covered call held to expiration. Loss probability is shown as buy-and-hold → covered call; the mean difference is the paired ending-value difference.
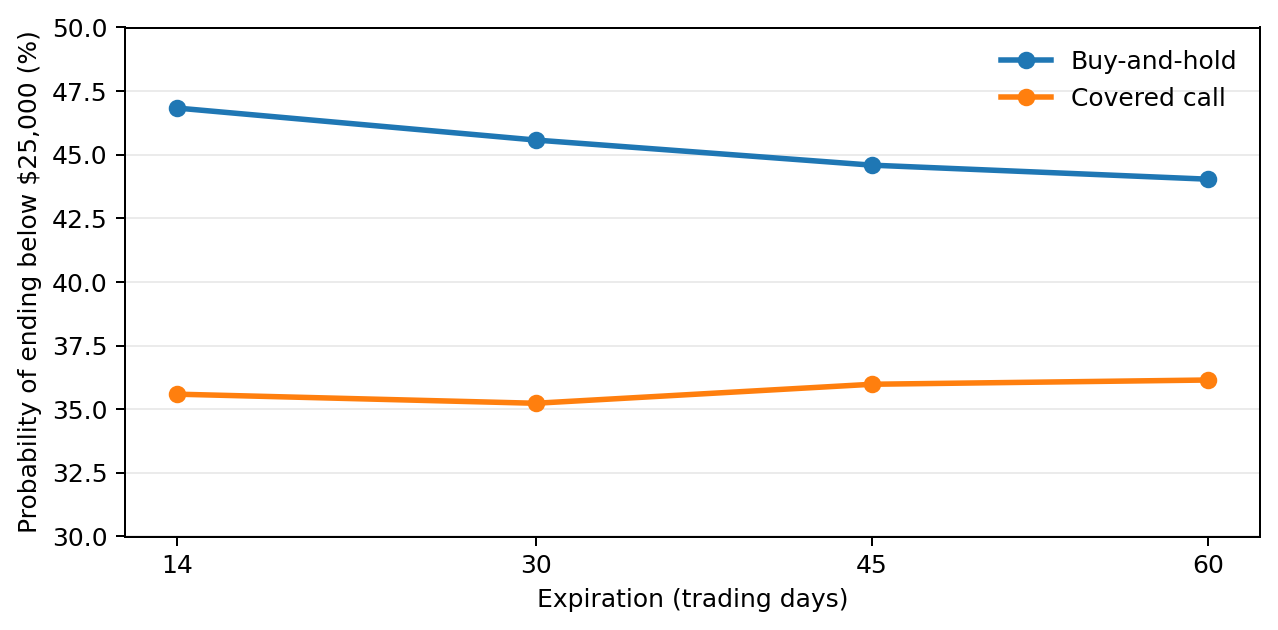
Figure 3. Probability of finishing below the initial account value for buy-and-hold and a single covered call across four investment horizons (14, 30, 45, and 60 trading days).
Risk reduction persisted across all four holding periods
The buy-and-hold curve also changes because each point represents a different holding period. Longer horizons provide more time for the assumed positive expected return to offset short-term fluctuations, reducing the probability of finishing below the initial account value even without selling a call.
The covered call lowered the probability of any loss at every holding period. The reduction ranged from 11.2 percentage points at 14 trading days to 7.9 points at 60 days. Ending-value standard deviation was lower by approximately 24%–28% in all four scenarios. The fifth-percentile ending value improved by exactly the option premium in each case, confirming that the premium remained a fixed lower-tail offset rather than a change in the stock-loss slope.
The covered-call probability of loss remained tightly clustered near 35%–36% even as the holding period increased. The buy-and-hold probability of loss declined slightly from 46.8% to 44.0%, so the gap between the strategies narrowed. Because strike selection changed discretely from $103 to $107, the results should not be interpreted as a perfectly smooth holding-period curve.
Total premium rose, but premium per trading day fell sharply
Extending expiration from 14 to 60 trading days increased total premium from $123.07 to $177.76, an increase of about 44%. The commitment period, however, increased by more than four times. Premium per trading day therefore fell from $8.79 to $2.96, a decline of roughly 66%.
Mean covered-call outperformance declined from $50.55 at 14 days to $16.44 at 60 days.
Average upside sacrificed across all paths rose from $72.52 to $161.32.
Average upside sacrificed when assigned rose from $273.12 to $604.02.
The covered call still beat buy-and-hold on 78.2%–81.7% of paths, while assignment frequency remained between 26.4% and 30.1%.
Within this one-call experiment, the shorter expiration produced the largest premium per unit of time and the largest average paired advantage. That does not establish that a repeated short-dated overwrite program would be superior. Repeated selling would introduce additional path dependence, execution costs, rolling decisions, and changing option prices that this test does not model.
Holding-period result:
Longer holding periods continued to reduce conventional downside measures, but the incremental cushion grew slowly while the average upside opportunity cost increased. In this simulator, holding-period length changed the timing and scale of the tradeoff; it did not eliminate the tradeoff.
Longer expirations continued to reduce conventional downside measures, but the incremental cushion grew slowly while the average upside opportunity cost increased. In this simulator, expiration length changed the timing and scale of the tradeoff; it did not eliminate the tradeoff.
Market regimes: the risk benefit was strongest in bearish conditions
CC-RISK-005 varied the annual expected stock return from -20% to +20% while holding annual volatility at 18%, expiration at 30 trading days, and the public simulator delta label at 0.30. Each regime used 100,000 paths and common random shocks. The experiment therefore isolates the directional assumption as closely as the deployed simulator permits.
The selected contract changed with the regime
The public simulator uses expected return in its strike and premium heuristics. As the assumed return became more bullish, the selected strike moved from $101 to $106 and the premium fell from $215.69 to $137.53. This test describes the simulator’s complete regime-dependent behavior; it is not a same-contract payoff comparison with only drift changed.
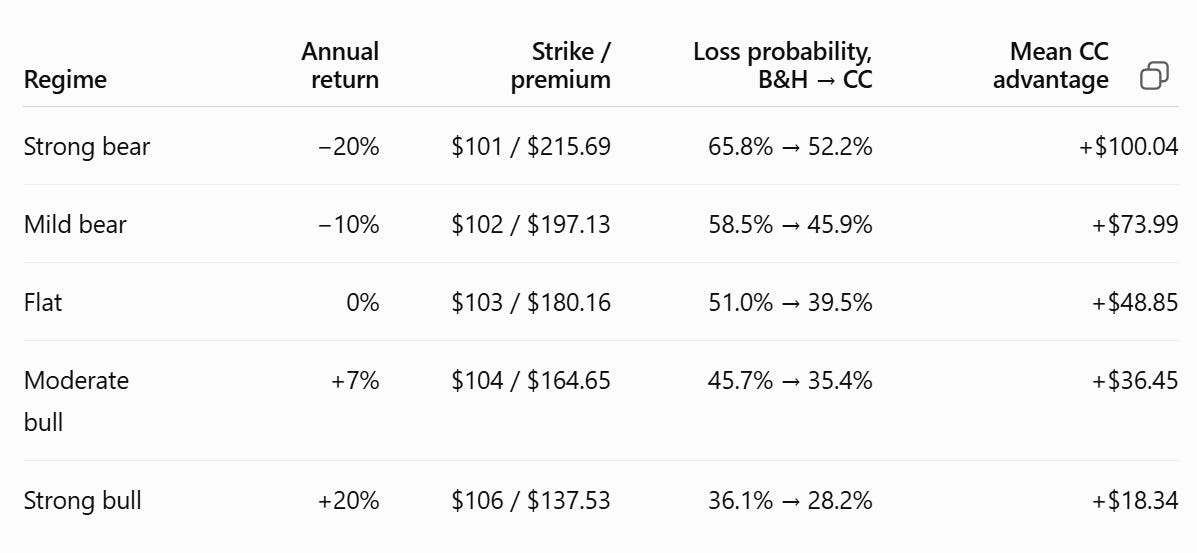
Table 5. Market-regime sensitivity. Loss probability is shown as buy-and-hold -> covered call; the mean difference is the paired ending-value difference.
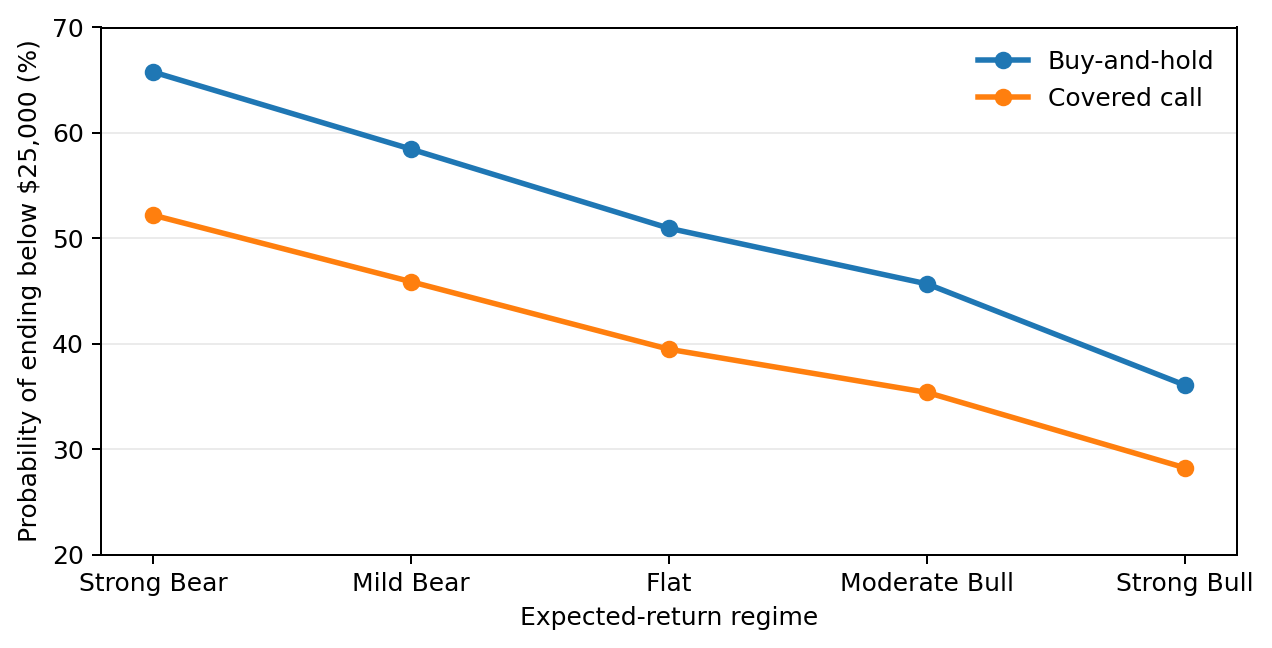
Figure 4. Probability of any loss across expected-return regimes.
The downside benefit persisted in every regime
The covered call reduced the probability of finishing below the initial $25,000 in all five regimes. The improvement was largest in the strong-bear scenario, where loss probability fell by 13.6 percentage points, and smallest in the strong-bull scenario, where it fell by 7.8 points. Ending-value standard deviation was lower by approximately 26% to 28% across the five regimes.
The fifth-percentile ending value improved by exactly the option premium in every regime. That recurring result is structural: the premium shifts the lower tail upward by a fixed amount, but it does not change the one-for-one exposure to stock losses below the strike.
The average advantage narrowed as the market assumption became more bullish
Mean covered-call outperformance declined from $100.04 in the strong-bear regime to $18.34 in the strong-bull regime. The covered call still beat buy-and-hold on approximately 78% to 82% of individual paths, but the value of the premium cushion fell relative to the stock’s stronger right tail as the expected return increased.
The total premium fell from $215.69 in the strong-bear regime to $137.53 in the strong-bull regime as the simulator selected progressively higher strikes.
Loss-probability reduction declined steadily from 13.6 to 7.8 percentage points.
The observed maximum upside sacrificed remained large, ranging from about $2,412 to $2,522 across regimes.
Assignment frequency remained comparatively stable, between 28.2% and 30.9%.
The positive mean difference in the strong-bull scenario should not be generalized into a claim that covered calls outperform in bull markets. This was a 30-trading-day experiment in which the simulator changed both strike and premium with the expected-return assumption. Over longer horizons, with a fixed contract, or during an unusually strong rally, buy-and-hold can dominate by much more than the premium received.
Market-regime result
The covered call provided its greatest conventional risk benefit in bearish conditions and its smallest benefit in the strong-bull setting. Direction changed the size of the tradeoff, but not its form: a limited premium cushion was exchanged for exposure to potentially much larger upside opportunity cost.
What risk did the covered call reduce?
Under the baseline assumptions, the covered call improved several conventional short-horizon risk measures:
The probability of finishing below the initial $25,000 fell from 46.55% to 37.48%.
The probability of a loss greater than 5% fell from 4.364% to 2.810%.
The probability of a loss greater than 10% fell from 0.094% to 0.044%.
The standard deviation of ending value fell by approximately 32%.
The fifth-percentile ending value improved by $164.65, equal to the premium received.
These are meaningful improvements, but they must be interpreted in scale. The premium represented only 1.65% of the $10,000 share position and 0.66% of the total $25,000 account. It softened losses; it did not transform the underlying stock exposure into a protected position.
What risk did it not eliminate?
The investor still owned 100 shares. If the stock declined sharply, the call premium absorbed only the first $164.65 of the loss. Beyond that cushion, the covered-call position continued to fall almost dollar-for-dollar with the shares. This is why a covered call should not be confused with a hedged position such as a protective put.
The strategy also introduced opportunity-cost risk. During strong advances, the investor could underperform buy-and-hold by far more than the premium collected. That underperformance is not a cash loss relative to the starting account value, but it is an economically important cost when the alternative is continued ownership of the uncapped shares.
A more precise answer
Does a covered call reduce risk?
Across all five experiments, yes - if risk means the probability of a modest short-term loss, ending-value variability, or lower-tail severity. No - if the phrase is understood to mean substantial protection from a major stock decline. The premium provided a fixed cushion, while the stock position retained nearly all downside below that cushion. The strategy also introduced opportunity-cost risk because its upside underperformance was not capped at the premium.
The completed pilot supports a narrow but defensible conclusion. A covered call can reduce several conventional measures of short-horizon risk, and it often finishes ahead because the premium helps in flat, declining, and mildly rising paths. But it is not broad downside insurance. Its protection is limited, its average-return effect depends on the distribution of outcomes, and its cost appears in the right tail where buy-and-hold can outperform by far more than the premium collected.
What the five experiments collectively show
Taken together, the experiments identify risk shaping - not automatic return enhancement - as the most robust effect of the covered call.
Loss probability and ending-value dispersion were lower in every controlled sensitivity scenario reviewed.
The lower-tail improvement was consistently limited to the premium received.
Larger premiums generally improved modest-loss statistics but required closer strikes, longer commitments, or richer volatility assumptions that increased upside opportunity cost.
Mean performance was not uniform: it improved in many controlled scenarios, but it was lower in the original baseline and at the highest volatility levels.
Bearish and flat regimes produced the strongest average advantage; the advantage narrowed as the expected-return assumption became more bullish.
Limitations of the pilot
The experiment modeled one covered call, not a continuing program of repeated sales, closing, rolling, or reassignment.
The stock paths were simulated rather than drawn from a historical sequence of market prices.
The public simulator uses simplified strike and premium heuristics rather than a complete live options chain with bid-ask spreads, implied-volatility skew, and changing Greeks.
Taxes, commissions, slippage, dividends, early exercise, and execution timing were not modeled.
The 7% drift and 18% volatility assumptions describe the baseline scenario; different assumptions can materially change the result.
Conclusion
Covered calls really can reduce risk, but only in a specific and limited sense. In this pilot, the option premium repeatedly lowered the chance of a modest short-term loss, reduced ending-value variability, and lifted the lower tail. It did not remove the fundamental risk of owning the stock. The investor exchanged a small, known cushion for an open-ended opportunity cost during strong advances. The strategy is therefore best understood as a redistribution of outcomes - less exposure to some ordinary losses, less participation in some large gains - rather than as a simple source of income or comprehensive protection.
Simulator and Research Availability
The free public Covered Call Simulator used for CC-RISK-001 through CC-RISK-005 is available at:
Readers may use the simulator to explore alternative assumptions and reproduce related scenarios. Because the public pilot may be updated over time, the numerical results in this article should be interpreted using the experiment settings and archived JSON, CSV, charts, and method notes associated with this study.
Recommended citation before DOI assignment: Morrissey, Mark L. 2026. “Do Covered Calls Really Reduce Risk? Five Monte Carlo Experiments Using a Free Covered Call Simulator.” Pilot Research Article, Version 1.0. Covered Call Risk Pilot, CC-RISK-001 through CC-RISK-005.
About the Author
Mark L. Morrissey is a retired Professor of Meteorology and an independent researcher. His work emphasizes quantitative methods, simulation, and clear communication of uncertainty. He develops educational tools and writes about evidence-based approaches to options strategies, portfolio risk, and retirement investing.